Creating Custom Dashboards
Important
To generate custom dashboards you need to use the RhodeCode Appenlight Logging API to export the data you want to chart. See the example scripts for doing this in the Logging API Script Examples section.
To create a custom dashboard, use the following steps.
- From the RhodeCode Appenlight home page, select
- Add a name in the Dashboard title files and save the chart. Then you can click on the Configure Chart button to start creating it.
- Configure the following basic chart settings:
- The Application from which the data is being monitored.
- Select the Chart Type.
- Choose between a Timeseries histogram or a Terms based chart.
- Select the Aggregation type from the drop down menu
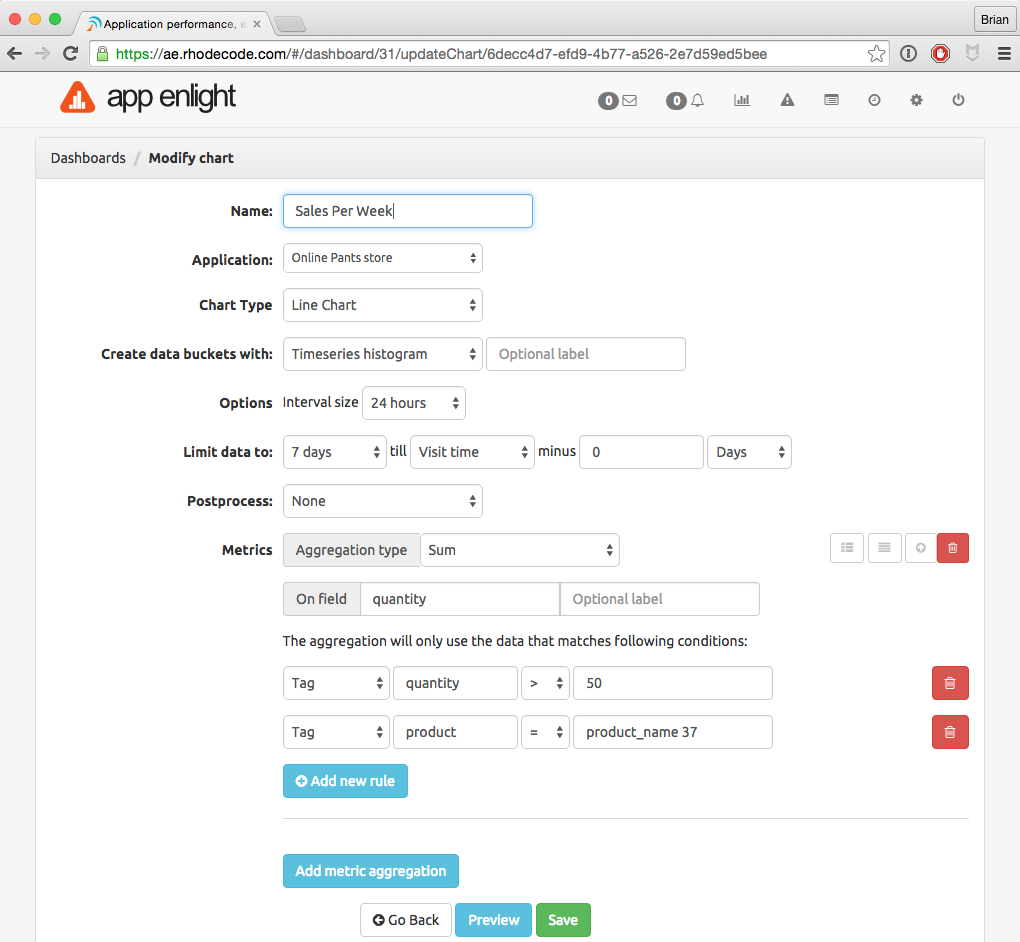
- From here on, it depends on what data is being used. In the following
example, this is being calculated:
- the sum of sales in which the quantity of items sold was over 50
- for product_name 37
- over the last 7 days